Table of Contents
- Introduction
- The Exponential Function for $a>1$
- The Exponential Function for $0< a<1$
- Influence of the Initial Value $C$
Introduction
An exponential function is a function of the form:
$\boxed{f(x) = C a^x}$
where $a>0, a \ne 1$ is a positive real number and $C \ne 0$ is a real number. The domain of $f$ is the set of all real numbers. The base $a$ is the growth factor, and $C$ is the initial value.
The exponential function $a^x$ is available as the NumPy ufunc np.power(a,x). The initial value $C$ can also be included using C*np.power(a,x). In the special case where the base $a$ is the Euler’s number $e=2.71828\ldots$, then we can also use the NumPy ufunc np.exp(x) to represent $e^x$.
The NumPy ufuncs for the various commonly-used exponential functions are tabulated below.
| Function | NumPy Ufunc | Alternative Syntax |
|---|---|---|
| $a^x$ | np.power(a,x) |
|
| $e$ | np.exp(1) |
|
| $e^x$ | np.exp(x) |
np.power(np.exp(1),x) |
| $2^x$ | np.exp2(x) |
np.power(2,x) |
| $e^x - 1$ | np.expm1(x) |
np.exp(x)-1 |
The Exponential Function for $a>1$
Let’s first import the relevant libraries and modules. In addition to the NumPy and Matplotlib libraries, the db_plot module consists of utility functions for plotting which will be discussed in more detail in our course on Plotting and Visualization with Matplotlib.
1import numpy as np
2import matplotlib.pyplot as plt
3import db_plot # module with functions for plotting
The exponential function $y=Ca^x$ is plotted for the case of $C=1$ and various values of $a>1$.
Example
Graphs of $y=a^x$ for various $a>1$. 1x = np.linspace(-2, 1.5, 50)
2fig, ax = plt.subplots(1, figsize=(6, 6))
3ax.plot(x, np.power(2,x), 'r-', linewidth=2, label=r'$2^x$')
4ax.plot(x, np.exp(x), 'g-', linewidth=2, label=r'$e^x$')
5ax.plot(x, np.power(3,x), 'b-', linewidth=2, label=r'$3^x$')
6ax.plot(x, np.power(4,x), 'c-', linewidth=2, label=r'$4^x$')
7# external module: move axes to cut at origin
8db_plot.shiftAxes(ax,1) # ax, grid on
9plt.legend(loc="upper left")
10fig.suptitle('The Exponential Function $y=a^x$ ($a>1$)',fontsize="13" )
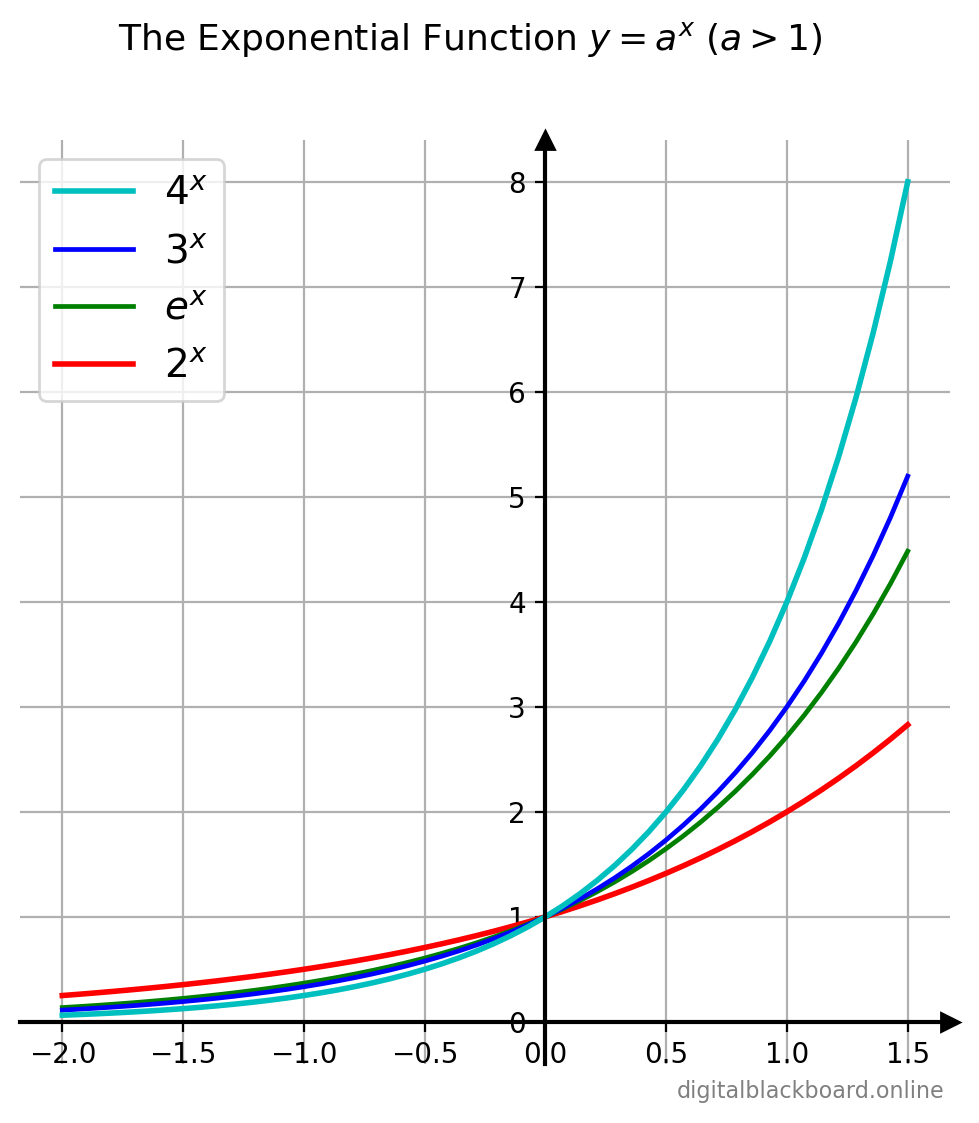
Notice that a smaller base $a$ results in a $y$ value that is smaller for $x>0$ and larger for $x<0$ and vice versa. For example, comparing $2^x$ and $3^x$, at $x=2$, $$2^2 < 3^2$$ But at $x=-2$, $$2^{-2} = \frac{1}{2^2} > 3^{-2} = \frac{1}{3^2}$$
ADVERTISEMENT
The Exponential Function for $0< a<1$
The exponential function $y=Ca^x$ is plotted for the case of $C=1$ and various values of $a$ where $0<a<1$.
Example
Graphs of $y=a^x$ for various $0<a<1$.1x = np.linspace(-1.5, 2, 50)
2fig, ax = plt.subplots(1, figsize=(6, 6))
3ax.plot(x, np.power(0.2,x), 'r-', linewidth=2, label=r'$0.2^x$')
4ax.plot(x, np.power(0.4,x), 'b-', linewidth=2, label=r'$0.4^x$')
5ax.plot(x, np.power(0.6,x), 'g-', linewidth=2, label=r'$0.6^x$')
6# external module: move axes to cut at origin
7db_plot.shiftAxes(ax,1) # ax, grid on
8plt.legend(loc="upper right")
9fig.suptitle('The Exponential Function $y=a^x$ ($0<a<1$)',fontsize="13" )
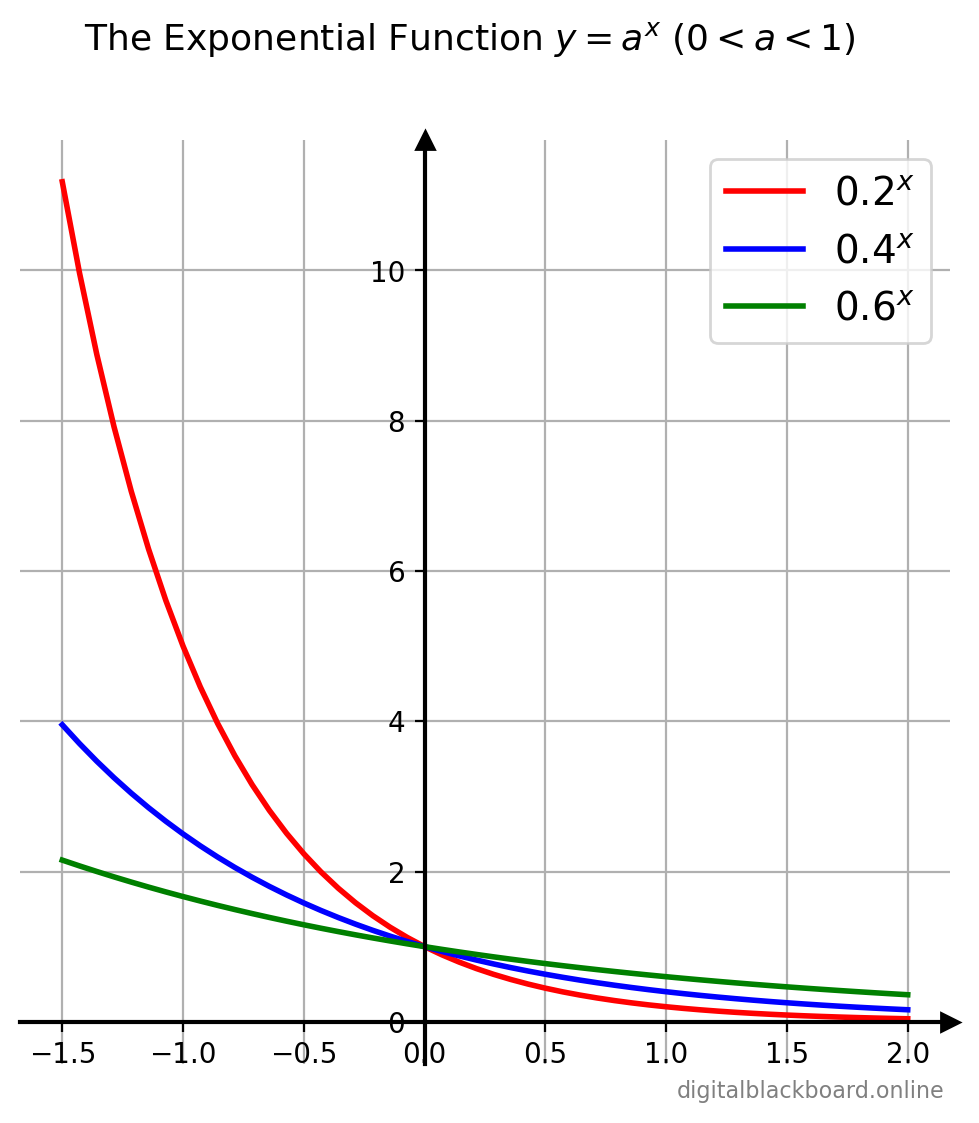
Notice once again that a smaller base $a$ results in a $y$ value that is smaller for $x>0$ and larger for $x<0$ and vice versa.
Also, note (from our study of transformations) that the graph of $y=0.2x = (\frac{1}{5})^x$ is merely a reflection about the $y$-axis of the graph of $y=5^x$ since
$$\left(\frac{1}{5}\right)^x = 5^{-x}$$
Influence of the Initial Value $C$
The exponential function $y=Ca^x$ is plotted for the case of $a=2$ and various values of $C$
Example
Graphs of $y=C\cdot2^x$ for various $C$. 1x = np.linspace(-2, 2, 50)
2fig, ax = plt.subplots(1, figsize=(6, 6))
3ax.plot(x, 2*np.power(2,x), 'r-', linewidth=2, label=r'$2\cdot2^x$')
4ax.plot(x, 3*np.power(2,x), 'b-', linewidth=2, label=r'$3\cdot2^x$')
5ax.plot(x, 4*np.power(2,x), 'g-', linewidth=2, label=r'$4\cdot2^x$')
6ax.plot(x, -2*np.power(2,x), 'c-', linewidth=2, label=r'$-2\cdot2^x$')
7ax.plot(x, -3*np.power(2,x), 'm-', linewidth=2, label=r'$-3\cdot2^x$')
8ax.plot(x, -4*np.power(2,x), 'y-', linewidth=2, label=r'$-4\cdot2^x$')
9# external module: move axes to cut at origin
10db_plot.shiftAxes(ax,1) # ax, grid on
11plt.legend(loc="upper left")
12fig.suptitle('The Exponential Function $y=C*2^x$',fontsize="13" )
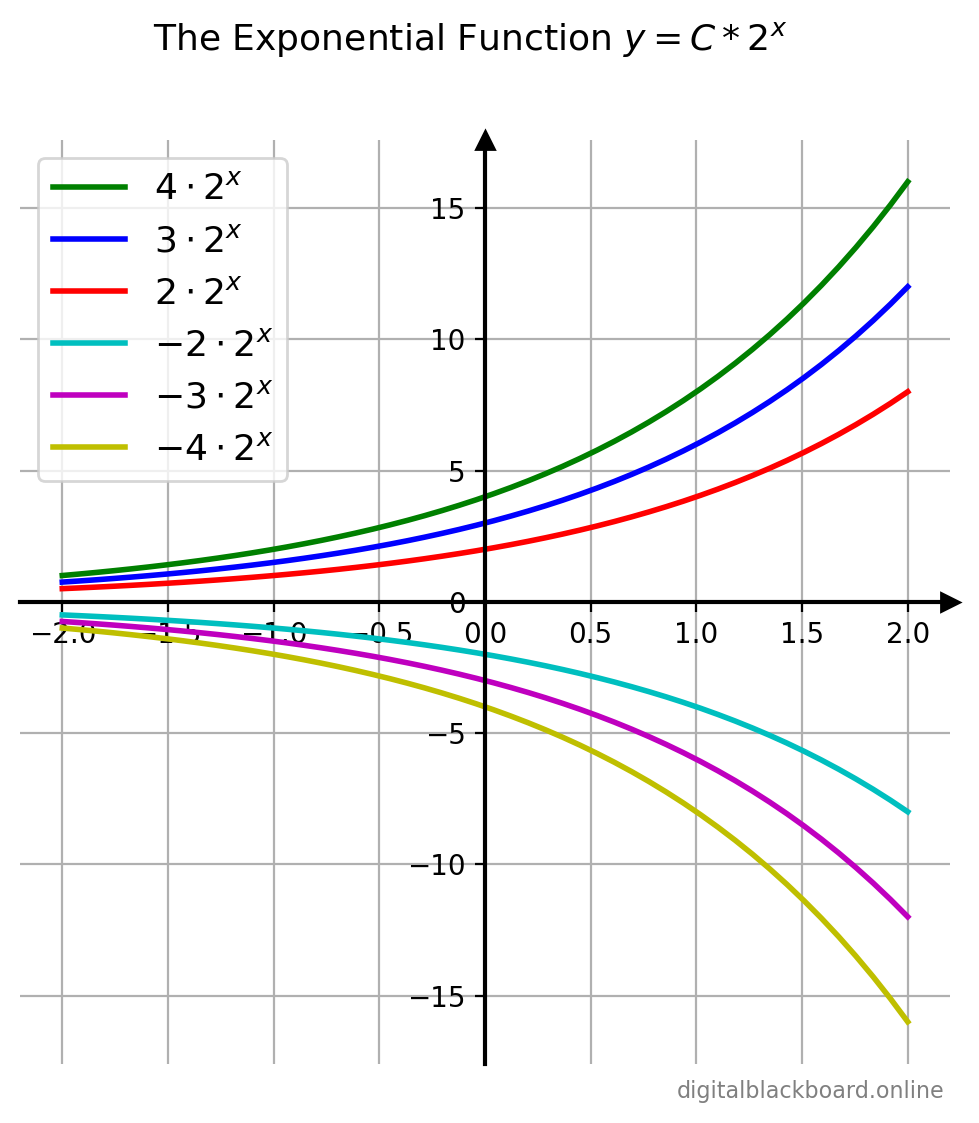
The result isn’t surprising from our study of transformations. For example, the graph of $y=-2a^x$ is merely a reflection about the $x$-axis of the graph of $y=2a^x$. Also the $C$ value is the scale factor that stretches the graph in the $y$-direction.